Exploring Scientific Data Files in VS Code with Xarray
Sunday, February 8th, 2026 (about 18 hours ago)
TL;DR#
Scientific Data Viewer is a VS Code extension that lets you explore NetCDF, Zarr, HDF5, GRIB, GeoTIFF, and other scientific data files directly in your editor. Built on Xarray, it displays the familiar HTML and text representations you know from Jupyter notebooks, making it easy to inspect file structure, dimensions, coordinates, and attributes without leaving your development environment.
Available on: VSCode Marketplace • Open VSX Registry
The Problem#
If you work with scientific data, you've probably developed a routine: open a terminal, start a Python REPL or Jupyter notebook, import xarray, load your dataset, and finally see what's inside. This workflow is fine for analysis, but it adds friction when you just want to quickly check a file's structure. What dimensions does it have? What variables? What's the time range?
Traditional tools exist, but each comes with limitations. ncdump is a classic command-line utility limited to NetCDF files, and its output becomes unwieldy for files with many groups or variables. Without interactivity, you're left scrolling through walls of text. Panoply offers a graphical interface and supports more formats (NetCDF, HDF, GRIB), but it requires opening a separate application, breaking your development flow. Neither tool supports newer formats like Zarr, or less common ones like GeoTIFF and JPEG-2000. In contrast, Scientific Data Viewer aims to open any format that Xarray can handle.
For quick inspection tasks, this context switch is costly. You might also find yourself with multiple tabs open, trying to remember which notebook was showing which file. And if you're working on a codebase that processes scientific data, you're constantly jumping between your code and external tools to verify inputs and outputs.
A Simpler Approach#
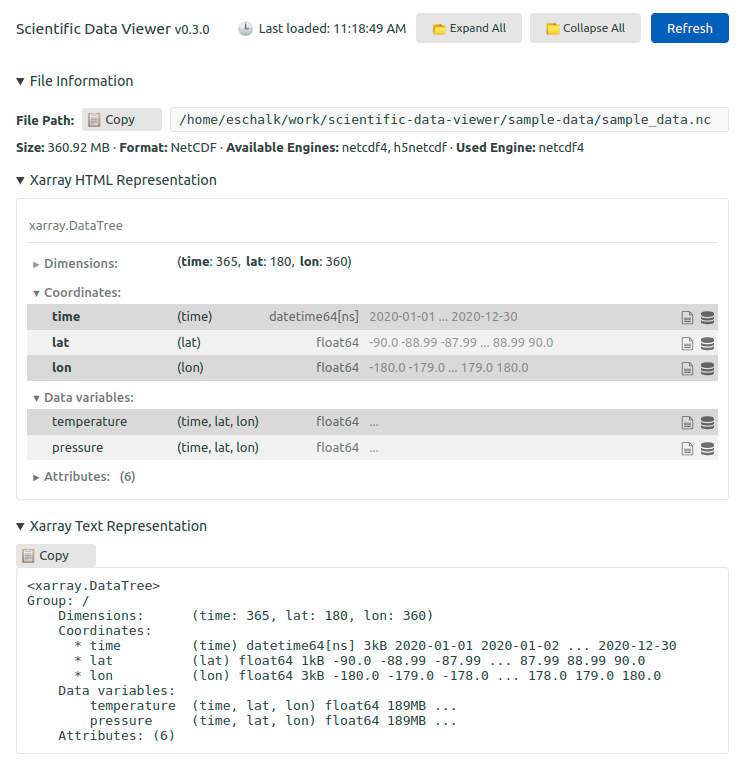
Scientific Data Viewer brings Xarray's data inspection capabilities directly into VS Code. Click on a .nc file in the explorer, and instead of seeing binary gibberish, you get the same rich representation you're used to from Jupyter:
The extension uses Xarray under the hood to open files and extract metadata. It supports the formats that Xarray supports, including:
| Format | Extensions |
|---|---|
| NetCDF |
|
| CDF (NASA) | .cdf |
| Zarr | .zarr |
| HDF5 |
|
| GRIB |
|
| GeoTIFF |
|
| JPEG-2000 |
|
What You Can Do#
Browse Structure Without Code#
The viewer displays comprehensive file information:
- File metadata: path, size, format
- Xarray HTML representation: the interactive, collapsible view you know from notebooks
- Xarray text representation: the traditional
print(ds)output - Dimensions and coordinates: with their types, shapes, and sample values
- Variables: with data types, dimensions, and memory usage
- Attributes: both global and per-variable
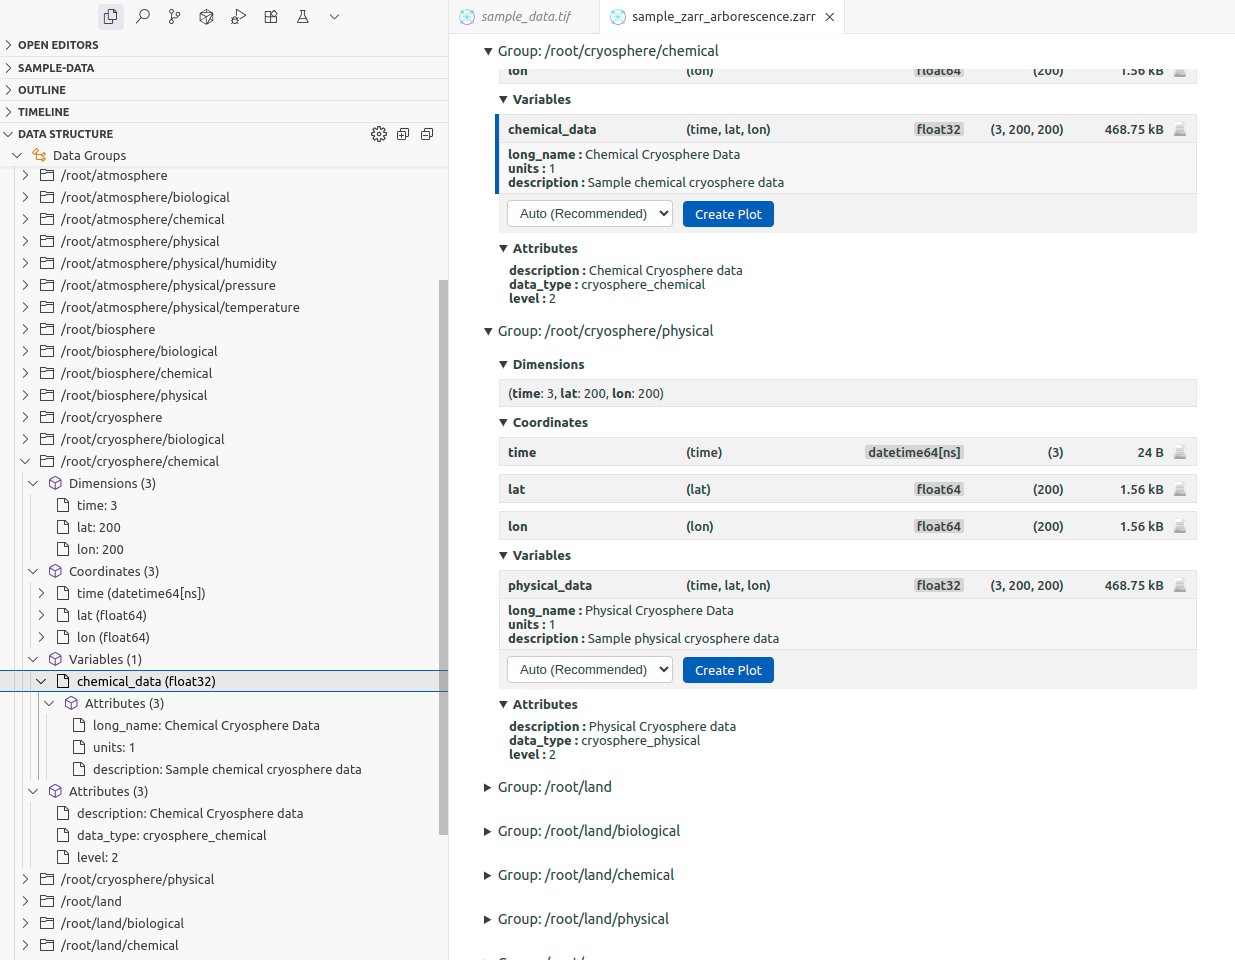
For files with hierarchical structure (like nested Zarr groups or HDF5 groups), the extension flattens the tree and displays each group's contents separately.
Tree View in the Sidebar#
A "Data Structure" panel appears in VS Code's explorer sidebar when viewing a scientific data file. This tree view mirrors the structure shown in the main panel and lets you quickly navigate to specific variables or groups.
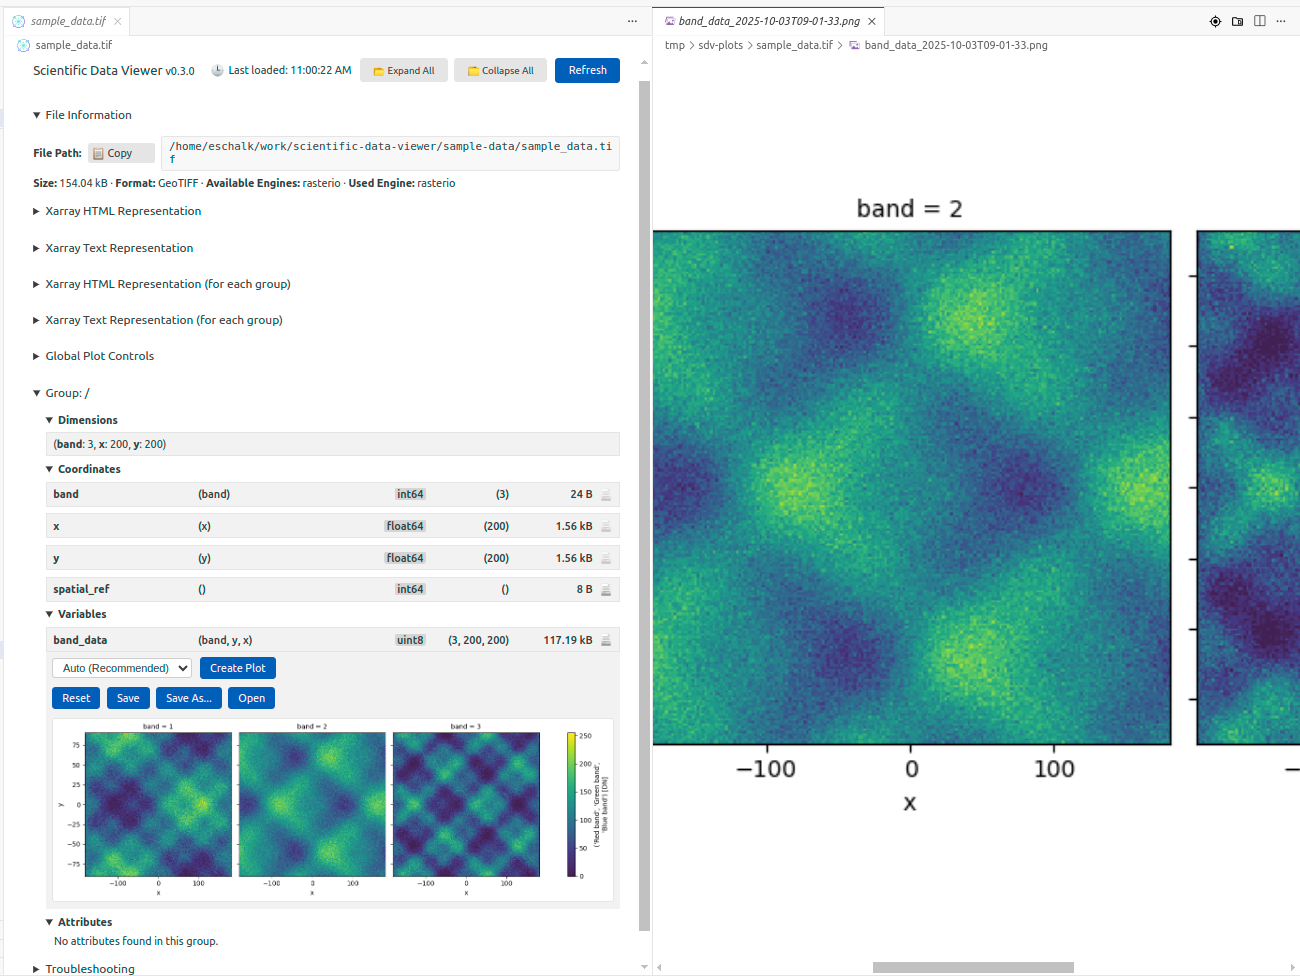
Basic Plotting (Experimental)#
The extension includes experimental plotting capabilities using Matplotlib. You can generate quick visualizations of variables directly in the editor—useful for sanity checks, though not intended to replace proper analysis tools. The plotting automatically adapts to your VS Code theme (light or dark).
Available on: VSCode Marketplace • Open VSX Registry
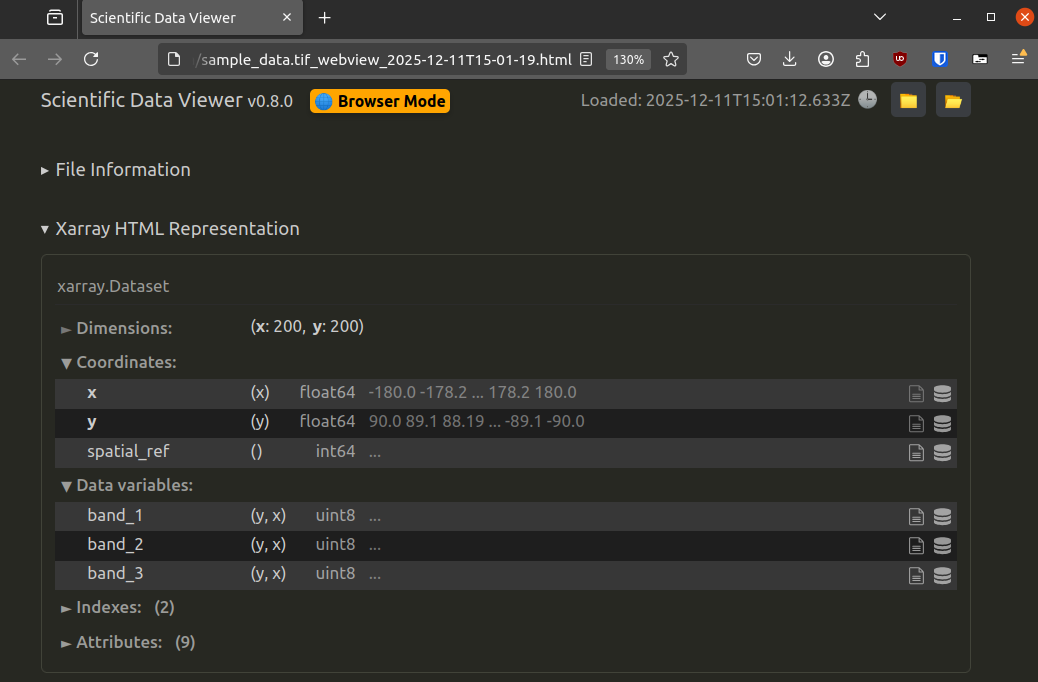
Export to HTML#
Need to share your data inspection results? The extension can export the entire viewer contents as a self-contained HTML report, including all metadata and representations. This is handy for documentation or for sharing with colleagues who don't have the data file.
Getting Started#
Installation#
- Install from the VS Code Marketplace or Open VSX Registry
- Ensure you have Python with Xarray and Matplotlib installed, or let the extension create its own isolated environment using uv
Required Python Packages#
The extension needs:
xarraymatplotlib
Plus format-specific packages as needed:
netCDF4orh5netcdffor NetCDFzarrfor Zarrh5pyfor HDF5cfgribfor GRIBrioxarrayfor GeoTIFF/JPEG-2000cdflibfor NASA CDF
The extension will prompt you to install missing packages when you first open a file that needs them.
Usage#
Once installed, simply click on any supported file in VS Code's file explorer. The file opens in the Scientific Data Viewer instead of showing raw binary. You can also:
- Right-click a file and select "Open Scientific Data Viewer"
- Use the command palette:
Ctrl+Shift+P→ "Open Scientific Data Viewer" - Drag and drop files into the editor
How It Works#
The extension is a bridge between VS Code's webview API and Python. When you open a file:
- The extension spawns a Python subprocess
- Python uses Xarray to open the file and extract metadata
- Xarray's HTML representation is captured and sent to the webview
- The TypeScript frontend renders everything in a VS Code tab
This approach leverages Xarray's existing format support and representation logic, rather than reimplementing file parsing in TypeScript.
Limitations and Future Work#
The extension is designed for inspection, not analysis. It's intentionally lightweight: you won't find sophisticated slicing, aggregation, or data manipulation features here. For that, using a proper notebook or script remain the best option.
The plotting features are basic and best-effort, but hopefully they will improve with future versions.
Contributions are welcome! The project is open source on GitHub. If you encounter issues or have feature requests, please open an issue.
Conclusion#
Scientific Data Viewer fills a small but useful niche: quick, frictionless inspection of scientific data files without leaving your editor. It's not a replacement for Xarray in notebooks: it's a complement that makes the "what's in this file?" question faster to answer.
If you spend time working with NetCDF, Zarr, or other scientific formats, give it a try. And if you find it useful, consider contributing back, whether by reporting bugs, suggesting improvements, or helping with development!
Thanks#
I would like to thank my colleagues: Nicolas Bertaud, Charles Le Mero, Yoann Rey-Ricord, Thomas Vidal, and Fabien Vidor for their valuable feedback and reviews on the extension stores. I am also grateful to the community members who contributed by reporting issues and suggesting features on GitHub: hbeukers, paulsally, ChunkyPandas03, fpartous and efvik.
Links: